The Early Warning System (EWS) is a system to help identify kids that are not preforming well. The system is based on four factors, attendance, log entries, current grades, and total credit. As students begin to hit these triggers a symbol will appear on most student screens, below the picture of the student. Once the indictor appears, the mouse can hover over the indicator to show what triggered the indicator. The indicator can be clicked on to view additional details. These details can also be looked at by clicking the link what says “EWS” on the left hand side.
How it Works
The EWS will notify users that this is an issue with a student by showing one of the indicators below.
|
Indicator |
Meaning |
|---|---|
|
One trigger has activated |
|
|
|
Two triggers have activated |
|
|
Three triggers have activated |
|
|
Four triggers have activated |
Early Warning System (EWS) Detail Page
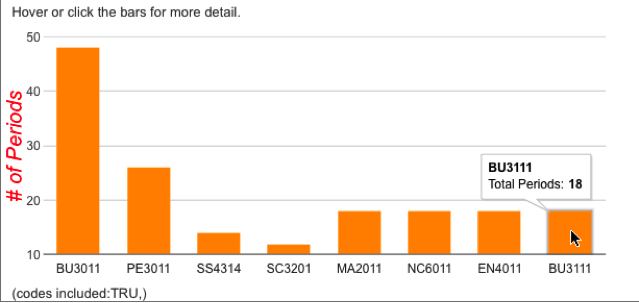
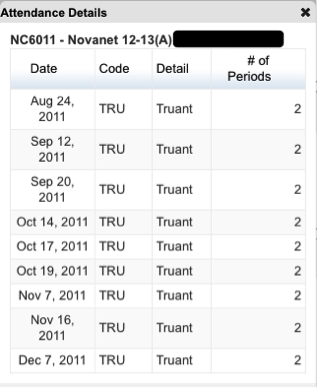
Attendance
An attendance graph will appear showing the total number of periods for each class (including dropped classes).The graph reflects the number of periods and NOT number of classes. If a class is 2 periods long, it will be accounted as two periods. The graph is interactive. Hover the mouse over a bar and the total number of periods will display. (Figure 1) Clicking a bar will open the details of each class. (Figure 2)
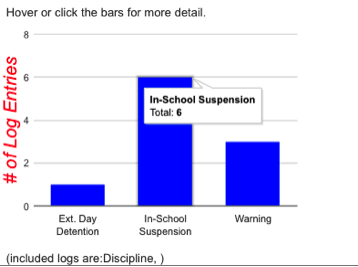
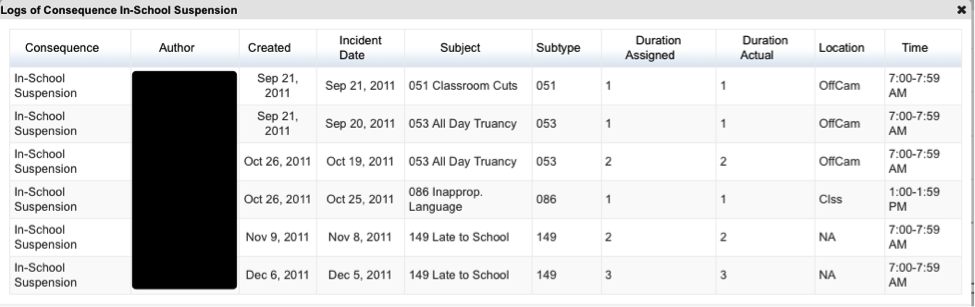
Logs
A logs graph will show the total number of log entries by consequence. This graph is interactive. Hover the mouse over a bar and the total number of logs will display. (Figure 3) Clicking a bar will display additional information about the logs (Figure 4)
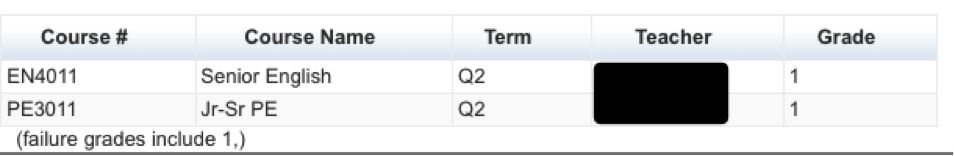
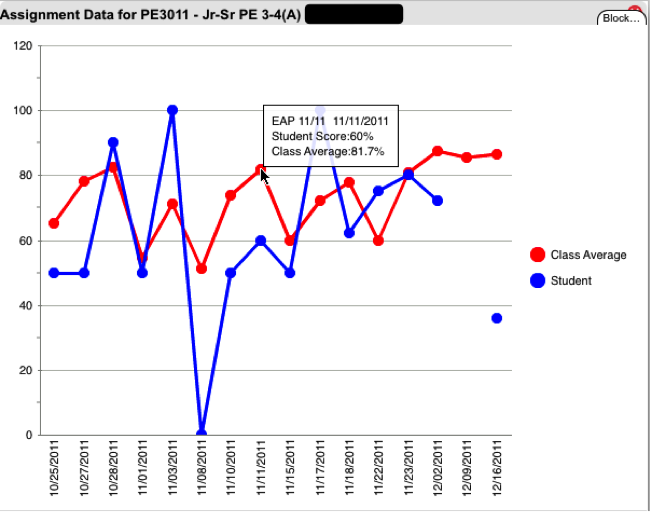
Failing Current Grades
This will show all the current classes that the student is failing. (Figure 5) This chart is interactive. Clicking a specific class will show a graph showing the student’s assignment scored against the class average. Hovering over any point will show the student’s score and the class average. (Figure 6)
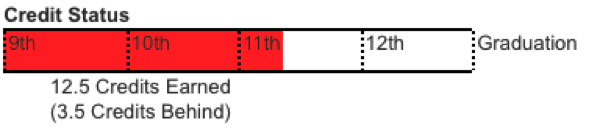
Historical Grades
This will show a credit meter to visually indicate how the student is going according to credits. The bar will turn red if the student is behind and green if the student is on track. Below the bar will indicate how many credit the student has earned, and if the student is behind, it will display how far behind the student. (Figure 7)
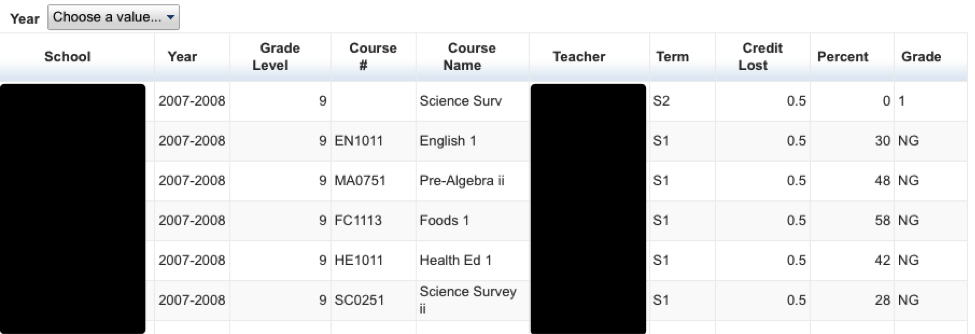
Under the credit meter is a list of historical classes where credit was lost. The chart can be filtered by year to help focus any research being done. (Figure 8)
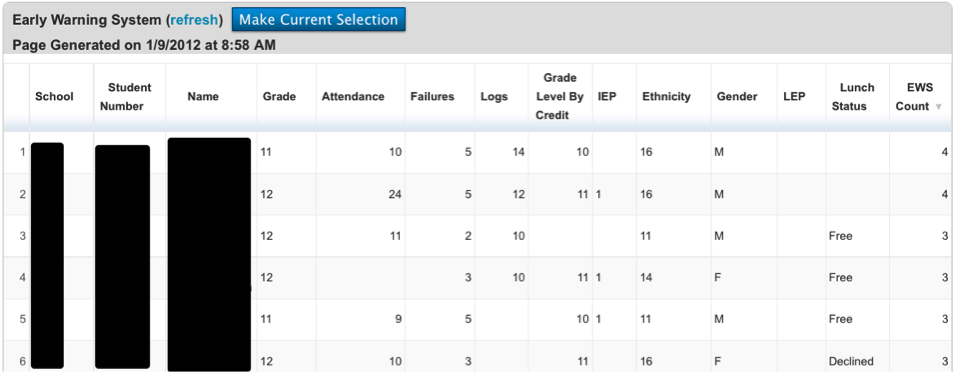
Early Warning System (EWS) Report
The EWS report can be run by to get a list of students that have been flagged as at risk. This report is available in PowerSchool Admin. Once logged in on the left hand side click Extended Reports>EWS Report. The report will automatically begin to run. It will take a moment for all the data to be collated. Once all the progress bars have finished, the below report will appear. (Figure 9) If additional information or reports are need, the students can be made into the current selection. Once the students are the current selection, all the functions of PowerSchool are available.