Data Dashboard
A customization has been created in PowerSchool to enable quicker, on-demand access to information. The Data Dashboard page allows data to be aggregated and charts created based on the data set chosen. Once that data has been loaded, filters can be used to narrow the data set to further dig into the data.
To access the Data Dashboard page
- Log in to PowerSchool
- Click Data Dashboard on the left side
Using the Data Dashboard page
- Make sure the term in the top right is set properly.
- If grades are being used, be sure the correct semester is selected
- Fill out the necessary parameters
- Click Load Data
- Some data sets will take several minutes to load
- Once loaded, the data will appear below in the tabs.
- The available tabs will adjust according to the data set and whether it is run at a school or district
- Some common tabs will be Graphs, Tables, and Data
- Graphs is a visual description of the data
- Tables is the data in table form
- Data is the raw data that can be downloaded
- If you want data to more comparative, click the Show Percentages checkbox
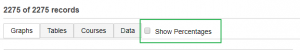
- Checking this box will change all the data to percentages.

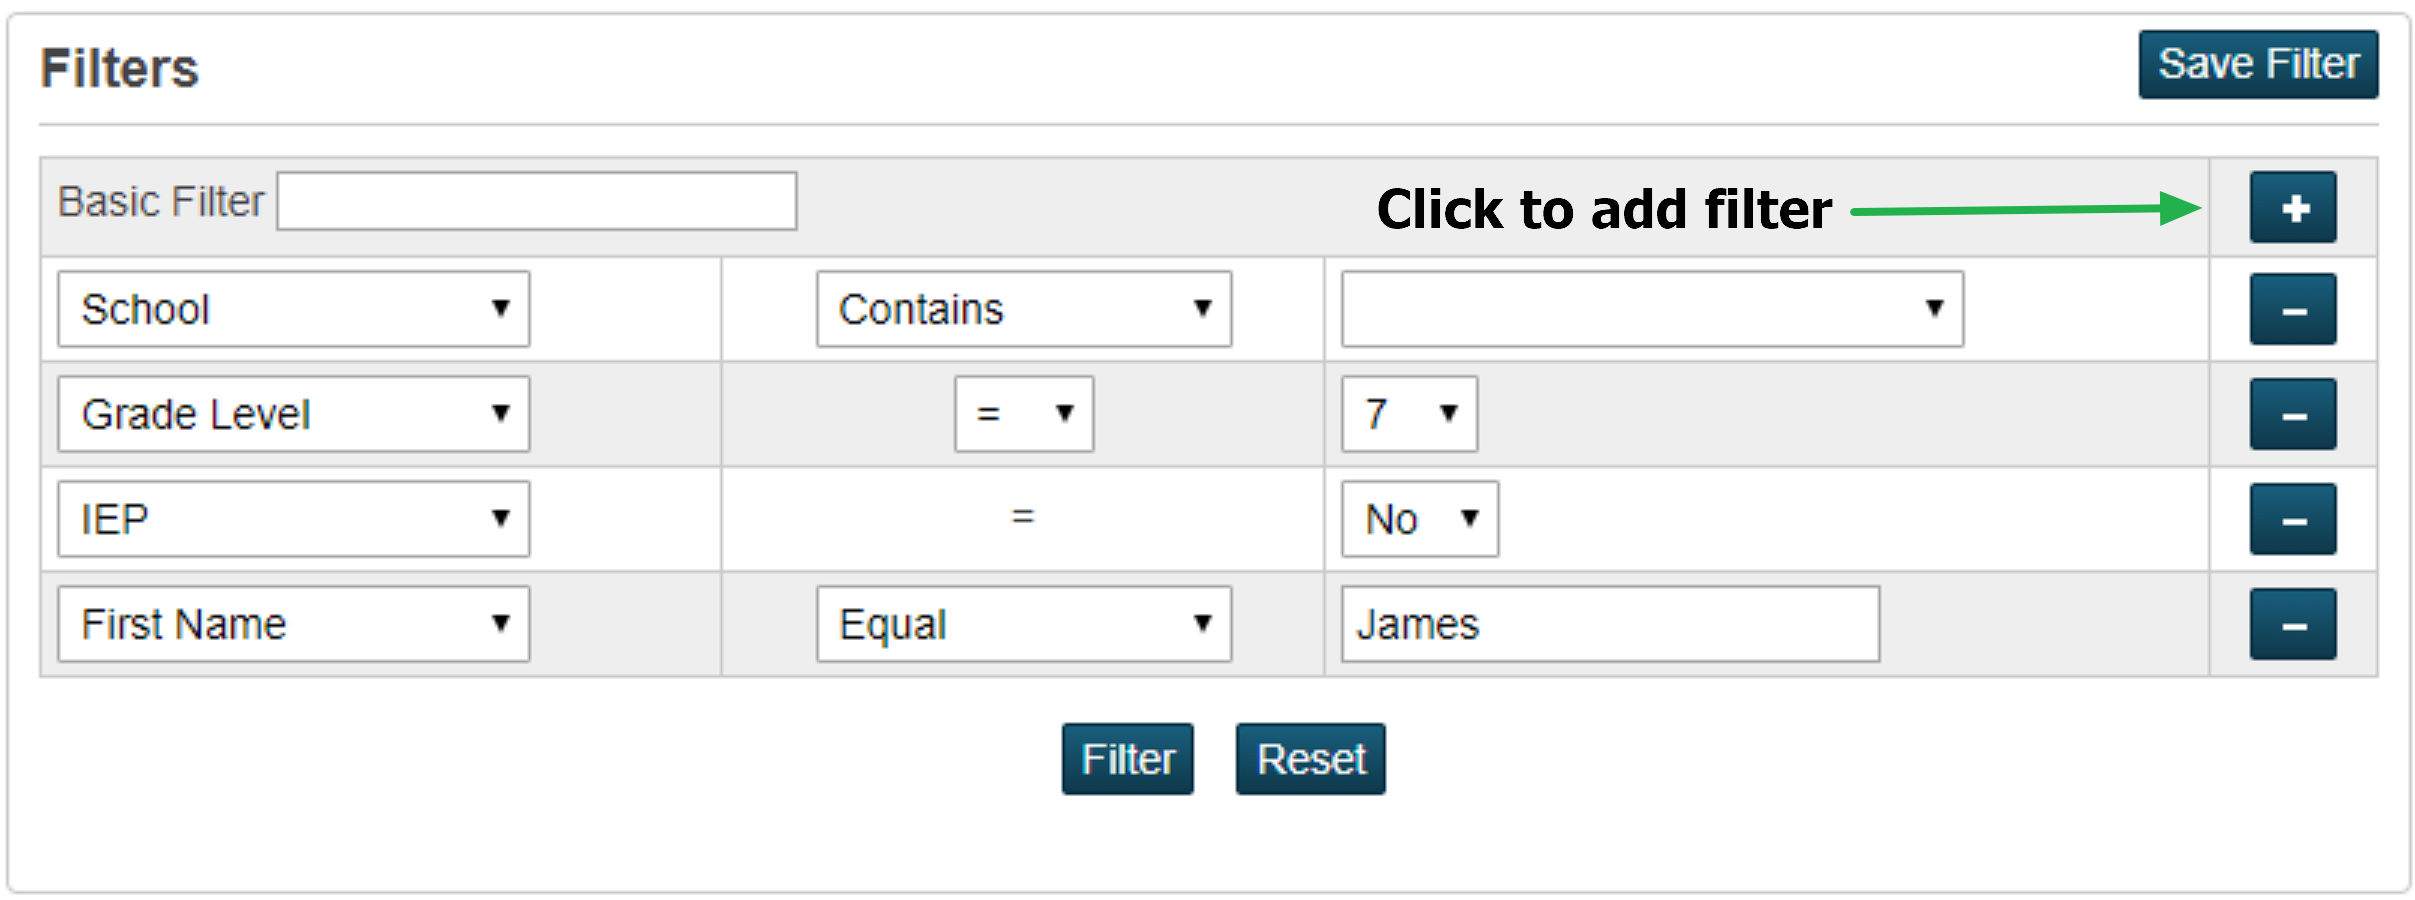
Filters
The most powerful tool on the Data Dashboard page is the ability to filter. There are two types of filters, basic and advanced. A basic file will match the text in any field in the data set. An advanced filter allows the filter to be fine-tuned to match exactly what is needed.
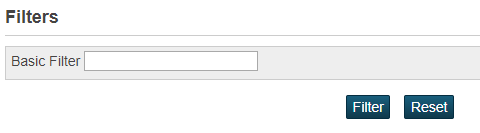
Basic Filter
The basic filter can be found at the top of the Filters box. Type in the text you want to filter and click Filter. This will only include records that contain that text anywhere.
Advanced filters
An advanced filter allows you to choose a specific field and filter based on different options. There are three basic types of data, number, text, and yes/no. Each of these types have comparators specific to that type. Below are the comparators
| Type | Comparator |
| text | Contains,does not contain,equal,not equal,starts with, ends with |
| Number | <=,>=,=,<,>,# |
| Yes/No | = |
To use an advanced filter, click on the ![]() to add a filter. Multiple filters can be added at a time to fine-tune the selection. If you have multiple filters, all filters have to match in order to be included in the data set. Also if the field says comma separated, multiple values can be entered with a comma separating each value.
to add a filter. Multiple filters can be added at a time to fine-tune the selection. If you have multiple filters, all filters have to match in order to be included in the data set. Also if the field says comma separated, multiple values can be entered with a comma separating each value.
Tips
- When on the Graph tab, clicking on a bar or the legend will add that filter in Filters and automatically apply the filters.
- If IEP grade 1 bar is clicked, then the filter will be set to IEP = Yes and Grade=1
- If there is a filter that is used often, click the Save Filter button. This will allow the saved filter to be applied later.
- If a more advanced analysis is needed, please download the data on the Data tab